
Click here to request Whitepaper: Regression Modeling Basics for AI and Machine Learning PDF.
Regression Modeling Basics
Regression Modeling itself is simple in principle (find a pattern between things) but often challenging to execute:
- Real-world Data can be Messy
Noise, outliers, and missing parts, among other things, make finding good patterns tricky
- There are Many Types of Regression Models
Regression modeling can be simple (straight lines) and very complex (curvy, wavy, multi-dimensional). Multi-dimensional regressions are common for many applications.
- Assumptions Matter
Regression models often assume things like “the relationship is linear” or “errors are random.” If these assumptions are wrong, the model can give bad predictions.
- Tuning and Selection
You have to choose the right model, right features, and sometimes even tweak settings (like adjusting model weights).
- Overfitting/Underfitting
If you fit the model too closely to your past data (overfitting), it won’t predict well for new cases; if you fit too loosely (underfitting), it misses patterns.
Learning some basics of regression is easy, and we’ve provided six quick examples that may help you determine which regression model to use and when. For our purposes here, we keep it simple.
Example 1:

You’re working in a factory that makes boxes.
Every day, you measure how heavy a box is depending on how big it is.
Over time, you notice that the bigger the box, the heavier it tends to be.
Now, you want to be able to guess the weight of a box just by looking at its size without having to weigh it every time.
This is where a regression model comes in.
You can think of a regression model as a smart helper that looks at past information (box sizes and weights) and learns a pattern. After learning, when you tell it a new box size, it gives you a good guess for the weight.
Here’s a simple way to break it down:
- You give the model examples (such as: 10 cm box = 2 kg, 20 cm box = 4 kg, 30 cm box = 6 kg)
- The model learns the relationship (bigger box → heavier weight)
- Then, when you have a 25 cm box, you don’t need to weigh it — the model can predict it will be about 5 kg
Why is this useful in a factory?
- It saves time: you don’t have to measure everything manually
- It improves planning: you can predict how much weight a truck will carry
- It helps in quality control: if a box is way heavier or lighter than expected, maybe something’s wrong in production
A regression model is like a smart guesser — it looks at old data, learns from it, and helps you predict numbers (like weight, cost, and time) based on new situations.
Example 2:

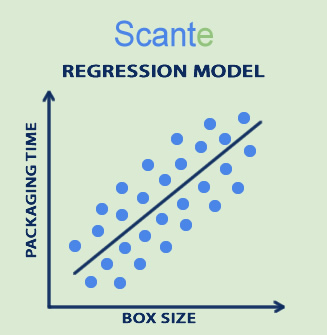
Imagine you’re trying to predict how long it takes to package boxes, depending on their size.
You collect a lot of data:
- Small box → 1 minute
- Medium box → 2 minutes
- Large box → 3 minutes
Sounds simple, right? It looks like a nice, straight pattern.
But real life gets messy:
- Some days, a worker is tired → packaging takes longer
- One day, a machine jams → slows everything down
- Different workers are faster or slower
- Some boxes are broken and need repacking
Now, your data might look like this:
- Small box → 1 min, 2 min, 4 min, 1.5 min
- Medium box → 2 min, 3 min, 5 min
- Large box → 3 min, 6 min, 7 min
Instead of neat points on a graph, your data is scattered all over!
It’s not a perfect line anymore — it’s a cloud of points.
This is often why regression modeling is tough:
- Which line do you draw? (many lines could fit!)
- How much do you ignore strange data? (jammed machines? tired workers?)
- Can you trust the pattern for the future? (what if a new machine changes the speed?)
In perfect conditions, regression is easy. In real factory life (with surprises, delays, and human errors), finding a good and reliable regression model becomes an art as much as a science. You can often find data in a messy scatterplot or “cloud of points,” as in the image below.
Example 3:

Imagine you have a big machine on your production line — it stamps metal sheets into parts.
Over time, you start writing down:
- How many hours the machine has run
- When it needed repairs
After a while, you notice:
The longer the machine runs without a break, the more likely it is to break down.
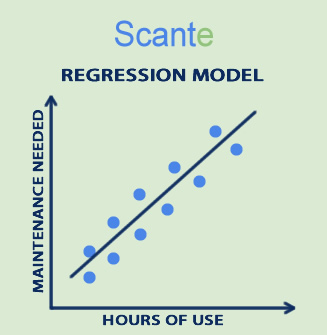
You can then use a regression model to learn the pattern between hours of use and chance of needing maintenance.
For example:
- At 100 hours → no repair needed
- At 200 hours → minor repairs needed
- At 300 hours → big repairs needed
The regression model looks at all this past information and learns how things usually go.
Now, before the machine even breaks, the model can predict:
“Hey, at about 280 hours, you should plan maintenance
— otherwise, it will probably break soon!”
Why this helps:
- You can schedule maintenance ahead of time instead of waiting for a breakdown
- It avoids stopping the whole factory because of unexpected problems
- It saves money — fixing a minor issue early is cheaper than fixing a big broken machine later
Here is a quick visual way to imagine it:
Think of a line drawn through dots on a graph — the dots are past machine hours and repairs, and the line helps you determine when the next repair is needed.
Example 4:

Imagine you run a factory where machines need regular maintenance (like changing belts, filters, bolts, etc.).
Ordering parts ahead of time is smart — but how much and when?
This is where a regression model can help.
How it works:
- You collect past data like:
- How many hours a machine runs before it needs a new belt
- How often a filter gets clogged
- How fast parts wear out under heavy use
- The regression model looks at patterns in this data:
- “Belts usually need replacing after 500 hours”
- “Filters fail faster if machines run at high temperatures”
- “Certain parts wear out quicker during busy production months”
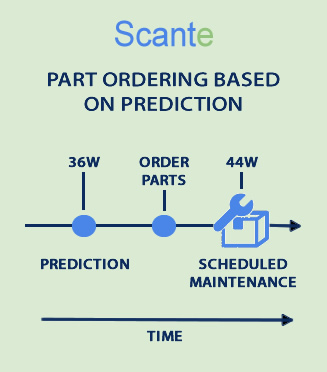
- Once trained, the model can predict:
- “This machine will likely need a new belt in 2 weeks”
- “You’ll probably need 20 filters next month.”
- You use this to order parts just in time:
- Not too early (wasting storage space and money)
- Not too late (avoiding machine breakdowns)
Real-world benefits:
- Save money — only buy what you need when you need it
- Avoid downtime — no waiting for parts to arrive after a breakdown
- Plan better — maintenance schedules and orders match the real machine wear patterns
Example 5:
If a regression model tells you that your stamping machine needs a new hydraulic seal every 1,200 hours, and you’re running it 200 hours a week, you can predict you’ll need a seal every 6 weeks — and order seals automatically just before they’re needed!
In short:
Regression models let you predict part needs based on machine usage and conditions — so you order smarter, save money, and stay ahead of breakdowns.
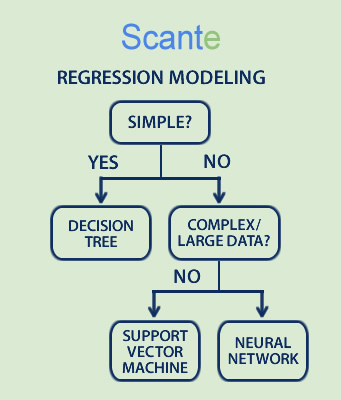
When performing regression modeling for machine learning, the appropriate use case for decision trees, support vector machines, and/or neural networks is necessary.
In regression modeling, you choose between Decision Trees, Support Vector Machines (SVMs), and Neural Networks depending on:
- How complex the problem is
- How much data you have
- How accurate and fast you need the prediction to be
- How much you care about understanding the model (“interpretability”)

Example 6:

Imagine you’re predicting when a conveyor belt motor will fail.
- If you want a simple, easy-to-trust model (like: “if motor temperature > 80°C for 2 hours, risk of failure is high”) → use a Decision Tree
- If you have a cleaner dataset with precise features (like vibration readings) and want very sharp predictions → use SVM
- If you have tons of sensor data, lots of conditions to track (temperature, load, speed, wear, etc.), and want to detect complex failure patterns → use a Neural Network
Simple real-life matching tip:
If it’s simple → tree
If it’s clean and small → SVM
If it’s huge and messy → neural network
You can help turn past data into reliable future predictions by utilizing the power of regression models. The success of any regression project depends heavily on selecting the right model for the specific problem at hand.
Simple models like decision trees offer easy-to-understand solutions for straightforward problems, while more advanced models like support vector machines (SVMs) and neural networks are better suited for complex, high-volume data challenges. Choosing wisely ensures better accuracy, faster insights, and more practical results, ultimately allowing businesses to save time, reduce costs, and operate more efficiently.
Summary
In today’s fast-moving world, the ability to predict, plan, and act confidently is a true competitive advantage — and regression models are at the heart of that ability. Yet the real power lies not just in using a model but in choosing the right one for the right situation. Simple problems call for clear, straightforward models; complex challenges demand deeper, more innovative solutions.
When we match the right tool to the right task, we turn information into action, uncertainty into opportunity, and ordinary operations into strategic success. The future belongs to those who can collect data and truly understand and predict with it.
Regression models turn data into foresight — but picking the right model turns foresight into real, actionable results. Success comes from not just using data but using it wisely.